Memory Contention & Unswap
In a proof of concept environment i am currently working in we have an issue with significant over-commitment of resource. Memory is currently around 3:1.
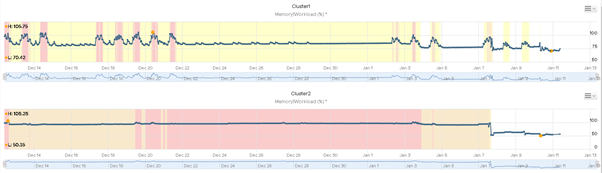
Because of this we are seeing workloads often hitting 100% with demand significantly higher:

During these periods, we can see VMs were seeing significant memory contention % sometimes exceeding 80%.

Obviously during these periods ESXi goes through its various high memory states employing ballooning & swapping to maintain availability. Below are examples of how much memory was swapped, there were some with larger figures but i had already unswapped them.

Fortunately since ESXi6 you have been able to unswap, moving pages back into memory. Its a fairly simple & quick proceed with little impact to VMs, one 5GB unswap took just 20seconds to complete. To complete this you should open 2 SSH sessions to your host, in one window run:
tail -F /var/log/vmkernel.log | grep Swap
This allows you to monitor the unswap process. In your 2nd window you firstly need to gather your vm world IDs
memstats -r vm-stats -u mb -s name:memSize:max:consumed:swapped | sed -n '/  +name/,/ +Total/p'

      name    memSize   max consumed  swapped
  vm.5487282    65536     -1    58978    15600
  vm.4368963    4096     -1      936      768
  vm.4370011   32768     -1     1187     4586
  vm.4370280    4096     -1      836      137
If you need to compare this with object names then you can gather the list from:
esxcli vm process list
Once you have this information you have 2 options, either unswap all the swapped memory or do it in smaller chunks to minimize impact. Below are the commands required:
Smaller Chunks e.g. 5GB:
localcli --plugin-dir=/usr/lib/vmware/esxcli/int vm process unswap -w 5487282 -s 5 -u GB

All Swap:
localcli --plugin-dir=/usr/lib/vmware/esxcli/int vm process unswap -w 5487282
While this is running, monitor the status in your first window.
![]()