Creating a view in vROPs
vRealize Operations Manager gives you the ability to take all the data and metrics it has ingested and use that to create smaller, more targeted, visual data for specific objects and metrics for a given time frame. Once created, these can be used independently or as part of dashboards and reports. Below, I will run through how to create a view so you can get started on your journey towards customizing vROPs to empower your business.
We’re going to create a view for displaying all VMs that have ballooned or swapped memory
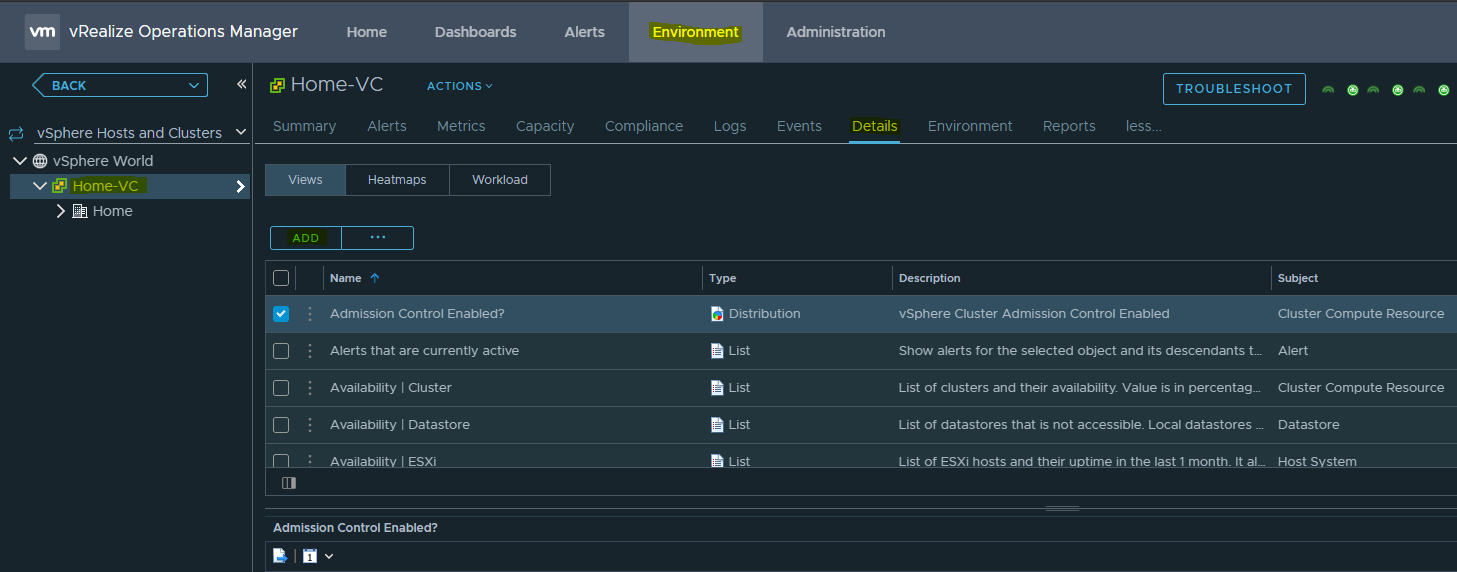
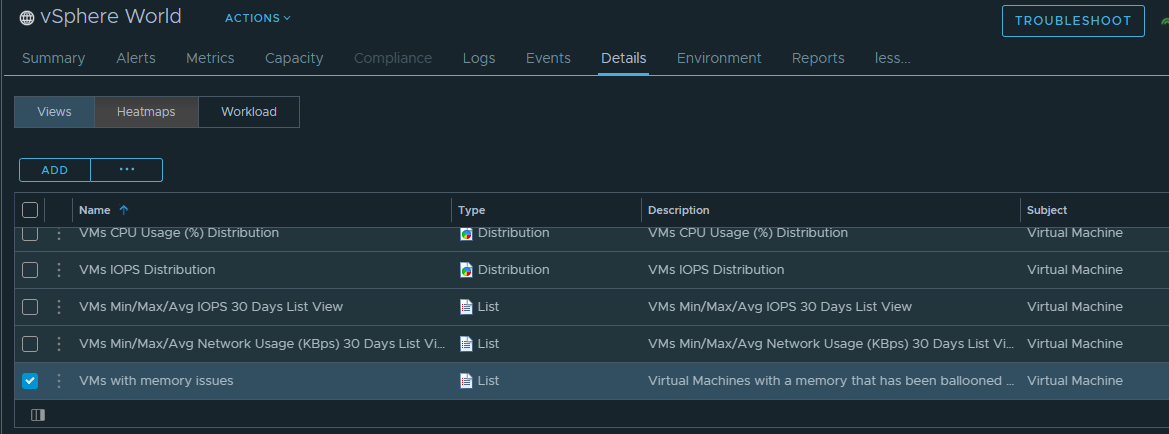
- in vROPs go to Environment, from there you’re going to chose the entire vSphere world or a specific vCenter, click details (which may be hidden) and finally click Add
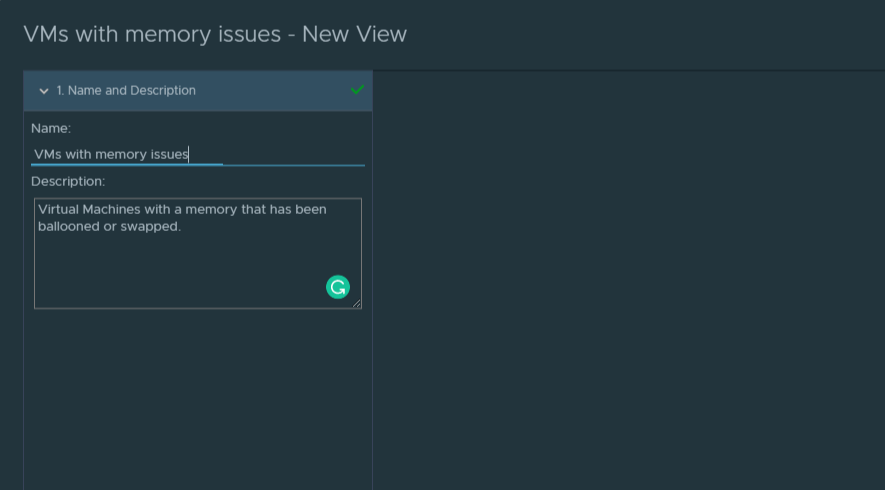
- Name your view
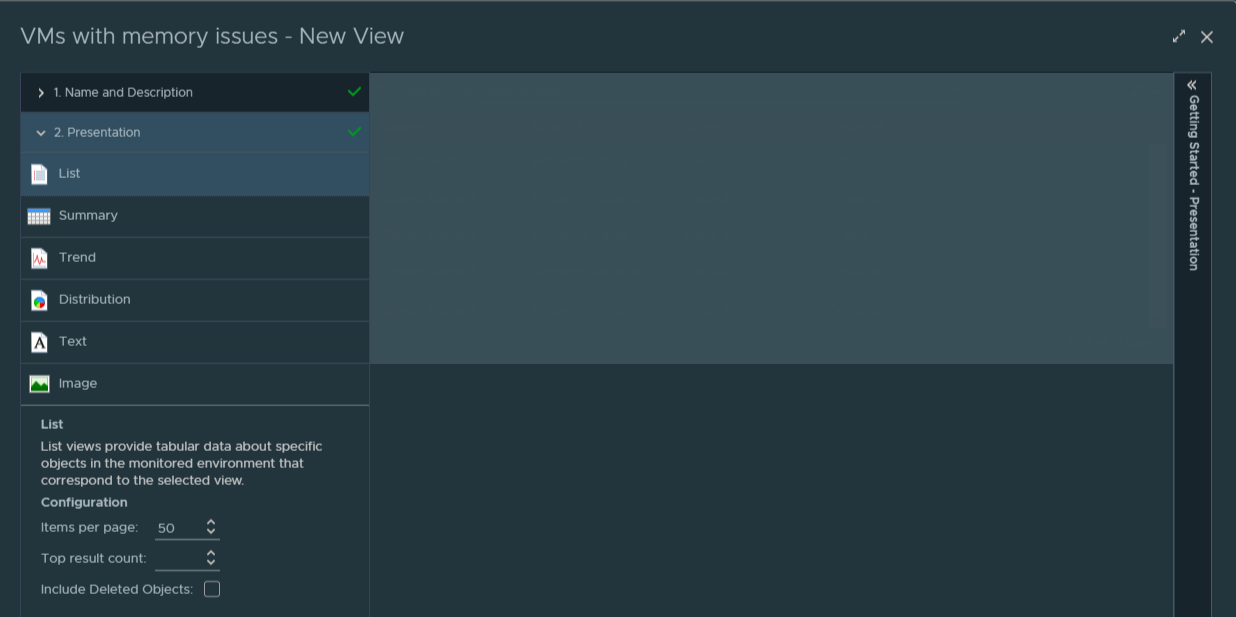
- Select how you want to display the results, here a simple list will work
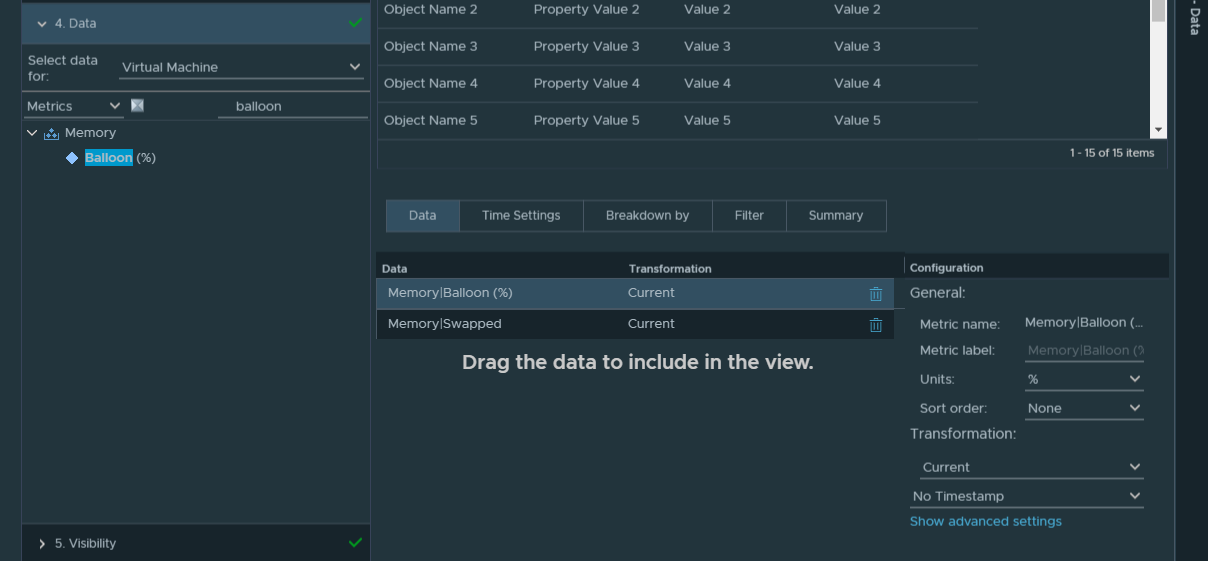
- Now we need to define what objects we will check against, for this view we will need to select Virtual Machines

- Select which metrics you want to be displayed, in this instance, were going to used Balloon% and Swapped(KB). This doesn’t impact what you will be filtering against.
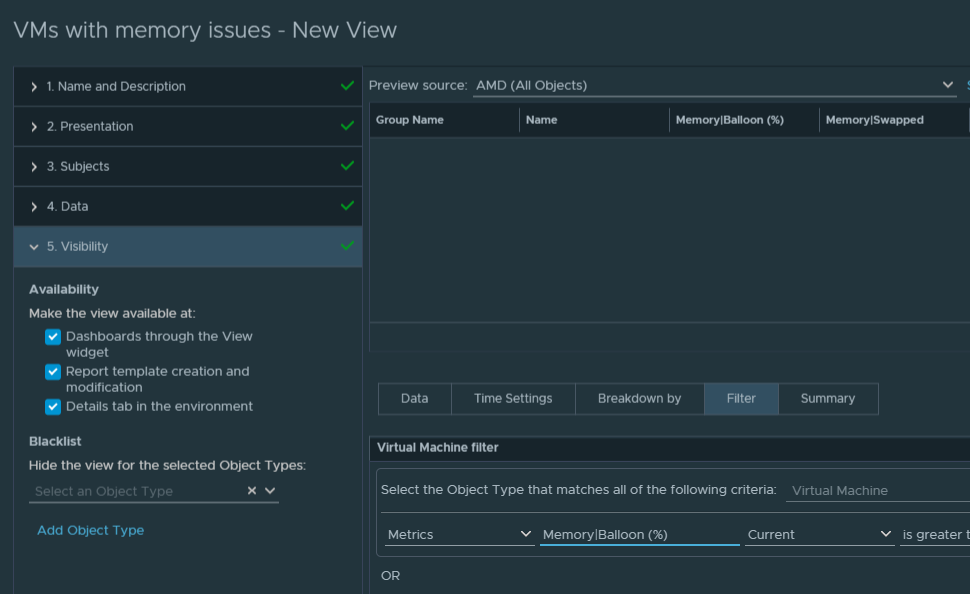
- Now we’re going to filter our results, this is where we decide what it is we’re looking for. On this view, we want to see any VMs that have Ballooned memory or great than 1Mb of swapped memory.

- Next, you can change the visibility options. I’m going to leave this default
- Finally, Hit save and confirm you can see your new view.
![]()